

Preemption latency of real-time Linux systems
How to measure it – and how to fix it, if it's too high?

From IRQ latency to preemption aka total latency
In contrast to earlier days when real-time work often was executed within the interrupt service routine, today's real-time programmers prefer to do the real-time work in user space. This makes development much easier, as the code can be debugged better, a crash does not automatically lead to a system crash, there is less stack limitation and the hardware independence allows to easily reuse the code on another platform. This change of paradigm of real-time software development required new methods to determine the response latency of a real-time system: The goal no longer was to document the deterministic execution start of the interrupt service routine (the "IRQ latency"), but to provide evidence that both the scheduler and the context switch guarantee that a waiting user-space real-time application will start not later than the maximum acceptable latency. This made it necessary to determine the "preemption latency" sometimes also referred to as "total latency" (see Figure 1).
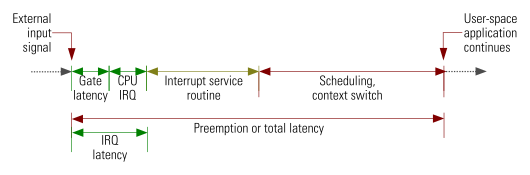
Figure 1: The pathway from input trigger to user space application – the preemption latency is considerably longer than the IRQ latency, since it includes running through the entire interrupt service routine as well as scheduling and context switching.
How to determine the preemption latency?
Measurement of stimulated latency
The standard method to determine the preemption latency of a system is to trigger preemption and to measure how long it takes until the stimulated preemption is completed and the user-space program under consideration continues execution after returning from the waiting system call. The tool that was created for this purpose is called cyclictest; it is part of the rt-tests suite. It does not use interrupts from an I/O controller but from an internal timer; anything else, however, is the same. When cyclictest is invoked it creates a defined number of real-time threads of given priority and affinity. Every thread starts a loop during which a timed alarm is installed and waited for. Whenever the alarm wakes up the thread, the difference between the expected and the effective time is calculated and entered into a histogram with a granularity of one microsecond. One of the options to stop execution of cyclictest is to preset the number of loops, for example, to 100 million. Such preset and an interval of 200 µs between consecutive alarms result in a total execution time of 5 hours and 33 minutes.
Internal long-term latency recording
In addition to the named recording of externally stimulated preemption actions, kernel built-in histograms can be used. The three distinct phases of the preemption, timer expiration, scheduling and context switch can be measured individually. In addition, the sum of the first two and the sum of all three latency components of a particular preemption action can be stored in two more histograms (see Figure 2).
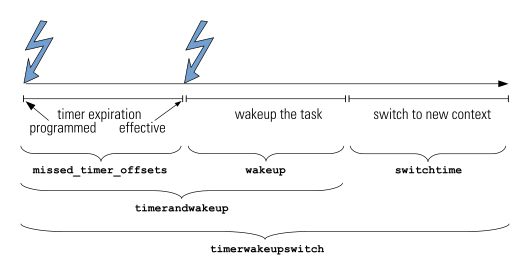
Figure 2: The three consecutive phases of latency recording
The histogram data can be accessed via the debug file system, usually mounted as /sys/kernel/debug, in the subdirectory /sys/kernel/debug/latency_hist. In addition to the histogram, characteristic data of the preemption action with the longest latency since the most recent reset are stored. This includes access to process ID, command name, scheduling priority and CPU core of the previous and the next task, and – only after context switch – the name of the system call from which the real-time task is returning. The goal of providing this extra information is to assist with latency hunting should a system exhibit unexpected high latency values. If the histograms are reset and the data of the longest preemption are stored every five minutes as it is, for example, the case in OSADL's QA Farm, latency peaks can be assigned to other events with this temporal resolution.
General difference between measurement of externally stimulated preemption and internal long-term latency recording
The main difference between the measurement of externally stimulated preemption and the internal long-term recording is that the latter can be used in addition to whatever software is running on a system and determine the effective latency of the task that has real-time properties at a given time. The cyclictest program, however, is intended as a placeholder of a real-time user-space program and cannot run in addition to it. In consequence, cyclictest is primarily used by kernel developers and hardware manufacturers who need to simulate a running real-time application. Internal long-term latency recording, in contrast, primarily is used by system integrators and application engineers who want to know the apparent latency of their system while the final software is running. Should a latency problem occur, internal long-term latency recording often provides the information that is crucial to fixing it (see example below).
An example from everyday's routine of a real-time system integrator
A newly setup dual-core embedded system (Intel Atom E3825 @1.33 GHz, formerly Bay Trail) suffered from heavy latency problems of more than 300 µs while latency values of less than about 60 µs were expected.
Measurement of stimulated latency
Figure 3 displays the latency histogram that was obtained after running cyclictest with 100 million cycles of 200 µs interval resulting in a total recording time of 5 hours and 33 minutes. In addition to sharp peaks with a maximum of about 45 and 70 µs, a number of unexpected sporadic latency values of up to more than 300 µs were observed.
Figure 3: Latency histogram with a large number of unwanted latency peaks; the three highest latency values (marked with grey arrows) will be used as an example how to investigate the origin of a latency (see Table 1).
As a disadvantage of a histogram, the timing information of the latency events is lost, and there is no way to retrospectively gain information which task was preempted by which task and which phase of the preemption was responsible for the elevated latency.
Internal long-term latency recording
In order to further debug the situation, the data of the internal long-term latency recording were analyzed. The cyclictest run was from 7.10 pm to 12.43 am and from 7.10 am to 12.43 pm in the two latency recordings over time in Figure 4a and 4b (marked with red lines at the top of the plot).
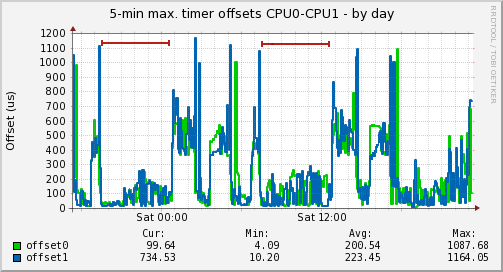
Figure 4a: Timer-related latency goes up to more than 300 µs during cyclictest run (from 7.10 pm to 12.43 am and from 7.10 am to 12.43 pm, marked with red lines) but it was expected not to exceed about 60 µs. This indicates that disabling interrupt processing is responsible for the observed elevation of latency values. The higher latency values outside cyclictest measurement are normal, since they result from allowing CPU sleeping and clock frequency throttling.
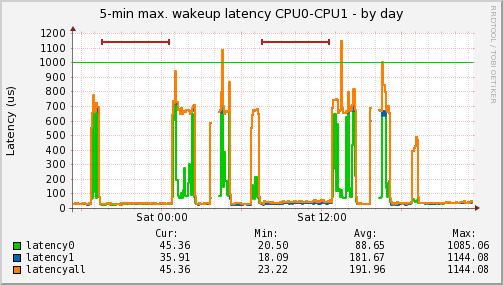
Figure 4b: The wakeup latency is not affected, as there are no latency outliers during cyclictest run (from 7.10 pm to 12.43 am and from 7.10 am to 12.43 pm, marked with red lines). The higher latency values outside cyclictest measurement are normal, since they result from allowing CPU sleeping and clock frequency throttling.
The task data of the three longest latency values are given in Table 1.
Delayed (victim) | Switcher (culprit) | Timestamp | CPU | ||||||
PID | Prio | Total | T*(,W**) | Cmd | PID | Prio | Cmd | ||
14374 | 99 | 334 | 321,5 | cyclictest | 28764 | -21 | meminfo | 11:10:23 | 1 |
14374 | 99 | 312 | 294,8 | cyclictest | 18154 | -21 | meminfo | 11:35:23 | 1 |
14373 | 99 | 308 | 294,7 | cyclictest | 26448 | -21 | meminfo | 11:45:22 | 0 |
Table 1: Example of the recorded preemption actions with the longest overall latency (timer + wakeup + switch) of consecutive 5-min intervals. They correspond to the three highest latency values in the histogram in Figure 3; the CPU cores in the table are marked with the same colors as in the histogram. The latency is most probably caused by disabled interrupt processing, since the large part of the latency occurs during timer expiration T, while the wakeup latency W and the switchtime latency (difference between T + W and total latency) are relatively short.
Apparently, the three highest (and all other not shown high) latency values (similar values and same cores as in Figure 3) occurred when cyclictest needed to preempt the non-real-time application meminfo but could not do so in time. As a side effect, these data reveal an excellent correlation between cyclictest data and built-in kernel histograms. Further analysis of the meminfo tool showed that real-time processes were delayed whenever the tool was reading the content of /proc/slabinfo. The problem was solved immediately when the related call was removed. But as a more general solution the /proc/slabinfo directory better should not be available at all. This was achieved by unsetting the kernel configuration item from
CONFIG_SLUB_DEBUG=y
to
# CONFIG_SLUB_DEBUG is not set
After the kernel was recompiled and installed, the /proc/slabinfo directory was gone and, as could be expected, the latency problem was solved. Even massive calls of the original version of the meminfo tool did no longer lead to any latency. Apparently, the kernel configuration CONFIG_SLUB_DEBUG was a leftover from the distro's default setting. Analysis of the kernel code that is connected with this configuration item showed that interrupts are, in fact, disabled while a large amount of debug information is collected and made available through the /proc/slabinfo directory.
To mainline, or not to mainline, that is the question
The above example is only one example of the many situations when internal latency recording has helped a lot to discover the source of a system's latency. Two of the three histograms, timer and wakeup latency are part of the PREEMPT_RT real-time patches and not in mainline kernel, the switchtime histogram even is not part of the real-time patches but still maintained separately in an off-tree repository.
With the currently increased activities to gradually merge the PREEMPT_RT real-time patches to mainline Linux, a first step was also taken to prepare the timer latency histogram for merging. However, kernel maintainers did not understand why this histogram would need to be integrated into mainline Linux in the first place – let alone implementation details, for example, why the data of the wakeup task are stored. They were, of course, absolutely correct to ask such questions, since the latency recording requires the histograms of all three – or at least the first two – components. The timer latency histogram alone does not make sense at all. Unfortunately, the wakeup and the switchtime histogram are more difficult to fit for inclusion to mainline Linux and may need much more thoughts. In addition, a way must be found to report the particular culprit's and victim's task data which probably is more important than just creating histograms. The recommendation, thus, would be to stop the activity of mainlining the timer histogram and wait until a solution is found to provide equivalent latency histogram and reporting functions in mainline as currently only available in the patches. Since these functions primarily are needed during system development and debugging and since they are less important for production kernels, it may even be acceptable to continue maintaining them in an off-tree repository.

