

OSADL Project: Latency Measurement Box
The OSADL Latency Measurement Box was developed by OSADL's Gold member ELTEC Elektronik AG in Mainz, Germany. It is based on a PowerPC CPU board with FPGA. The FPGA is programmed to manage the latency measurement, the CPU (running under Linux) takes care of the user interface and the network connectivity. Figure 1 displays the front panel of the device (100 x 170 x 400 mm). For details, please refer to the Users' Manual (in PDF format) below.
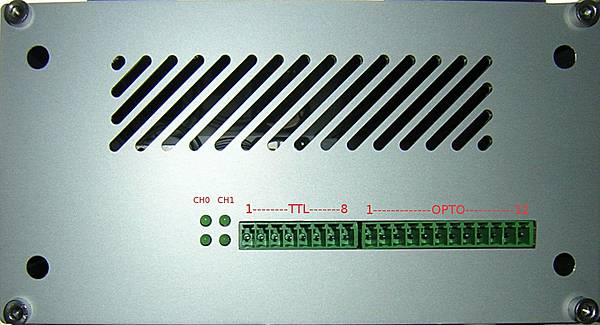
- Figure 1: Front panel of the OSADL Latency Box: Two LEDs indicate the meassurement status, the trigger output and measurement inputs are available with TTL level or opto-coupled.

Technical data
- CPU PowerPC 750FX @ 600MHz
- 512 kB on-chip L2 cache
- 64 MB SDRAM on SODIMM
- One 10/100 Mb/s network interface (10BaseT / 100BaseTX)
- Two serial channels
- Embedded Linux BSP support
- 16 MB (optionally 32 MB) Flash EPROM
- Two TTL/OPTO output trigger channels
- Four TTL/OPTO input ports
- Four measurement indicator LEDs
- One RS232 interface via a D-sub (DE-9) connector (U-Boot)
- One RS232 interface onboard (for debug purposes)
- One RS485 channel, opto-decoupled
- +6.3 V supply voltage
Availability
OSADL members may obtain the OSADL Latency Measurement Box on loan free of charge. If you are not an OSADL member but would like to get the box on loan anyway, or if you want to purchase the box from OSADL, please contact us at infoªosadl.org.
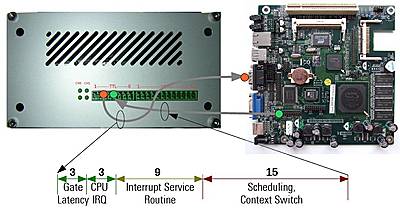
Interrupt path flow from an external event to the scheduling of a user-space application
- Figure 2: The latency measurement is based on an interrupt flow from an interrupt-driven I/O controller through the Interrupt Service Routine of the related driver to the execution of a user-space application that is waiting for this particular I/O operation.

The path flow of an external interrupt detected at one of the system's I/O controllers which will finally lead to the scheduling of a user-space application is exemplified in Figure 2. The first two sources of latencies, the gate and the CPU latency are normally relatively short and defined by hardware; software components have no influence on it. Only the interrupt service routine that is part of the related device driver may be well or less well written and, thereby, influence its execution time and, thus, create latencies. In addition, the locking that is necessary during execution of the interrupt service routine may create latencies. Some operating systems - such as Mainline Real-Time Linux - are, therefore, equipped with mechanisms to reduce the time intervals while the system is locked. So-called interrupt threads allow the system to move a part of the interrupt server routine to sleep state should another interrupt with a higher priority arrive.
At the end of the interrupt service routine, the kernel will prepare the scheduling of the user-space application that is waiting for this particular I/O operation. A high system load, inappropriate locking and other software shortcomings may lead to a delayed execution of the user-space application which will result in a prolonged system latency. The OSADL Latency Measurement Box is used to detect such latencies. Before a Mainline Real-Time Linux version is released, a number of different systems have been tested using the OSADL Latency Measurement Box in order to ensure a continuous high quality of its real-time capabilities.
![]()
Principle of the experimental set-up
- Figure 3: Experimental setup. The trigger output of the OSADL Latency Box is connected to an interrupt-driven input of the CPU under test, a general purpose I/O output of the CPU is connected to the measurement input of the OSADL Latency Box.

To demonstrate the principle of the experimental set-up of using the OSADL Latency Measurement Box, a single-channel latency measurement is shown in Figure 3. The trigger output of the OSADL Latency Measurement Box is connected to an I/O channel of the CPU under test. This I/O channel (e.g. a handshake line of a serial interface) triggers an interrupt that leads to the execution of the related interrupt service routine which, in turn, causes the kernel to schedule a user-space application that must be provided for this measurement. The one and only functionality of this user-space application is to wait for input from the I/O channel and to signal the arrival of the event to the output pin of a general purpose digital output device (e.g. a parallel printer interface). Preferably, this output signal is not transferred via an interrupt-driven output operation but through a direct write action into the controller's data register. The related output pin is connected to the OSADL Latency Measurement Box; when flipped, it stops this particular latency measurement and causes the OSADL Latency Measurement Box to enter the result (time interval in microseconds since the trigger signal was sent) into the latency histogram.
![]()
Data evaluation
- Figure 4: Example of a resulting latency histogram. The vertical green line denotes the worst-case latency.

At the end of an entire test that often comprises millions (or even billions) of single latency measurements, the latency histogram is transferred from the OSADL Latency Measurement Box to a host computer system where the final evaluation is done. An ftp and a Web server are provided for this purpose. Sample scripts are available on the OSADL Latency Measurement Box that can simply be downloaded. Figure 4 gives an example plot of the resulting latency histogram. A semilogarithmic scale is used to improve the representation of less frequent latency values. The longest latency interval detected defines the "worst-case latency" of the CPU under test. It is marked with a green vertical bar in the latency histogram.
It should, however, be noted that such latency measurements are only meaningful, if an adequate CPU load is generated during the test.
For calibration purposes, the system may be blocked for a defined time interval; for this purpose, the Linux driver blocksys was developed. It can be downloaded from here.
![]()
Documentation and Users' Manual
Users' manual of the OSADL Latency Measurement Box | 777 K |

