

Dates and Events:
|
OSADL Articles:
2023-11-12 12:00
Open Source License Obligations Checklists even better nowImport the checklists to other tools, create context diffs and merged lists
2022-07-11 12:00
Call for participation in phase #4 of Open Source OPC UA open62541 support projectLetter of Intent fulfills wish list from recent survey
2022-01-13 12:00
Phase #3 of OSADL project on OPC UA PubSub over TSN successfully completedAnother important milestone on the way to interoperable Open Source real-time Ethernet has been reached
2021-02-09 12:00
Open Source OPC UA PubSub over TSN project phase #3 launchedLetter of Intent with call for participation is now available |
Will we always wake up in time?
The Linux real-time kernel now contains a wakeup latency recorder to continuously monitor the real-time capabilities of a computer system

Path analysis vs. latency measurements
There have been many discussions on the merits of path analysis vs. latency measurements to determine - and to certify - the real-time capabilities of a computer system. Without doubt, path analysis is the "gold standard" and should be done whenever possible. However, today's high-performance processors no longer permit to simply add the number of machine cycles of individual assembly instructions in order to determine the duration of a particular path. First, such machine cycle tables are no longer available and, second, even if they were, there are too many mechanisms that may prevent a modern processor from executing a given assembly instruction in time. More on the discussion of path analysis vs. latency measurements is available here. As a consequence, in-vivo measurements of a system's worst-case latency are becoming more important. The PREEMPT_RT patched Linux kernel contains such a tool that recently has been improved to allow for the long-term continuous monitoring of the latency of every single real-time wakeup call that ever happens during the entire lifetime of a system. This may still not be as good as path analysis but is certainly a lot better than what we had before. At least, the obtained worst-case latency is no longer probabilistic but deterministic, since we do not estimate the latency in a test scenario but we determine it in the real world.
Two different latency scenarios
Latency of a process that exclusively uses the highest priority of a system
This is an ideal design which makes the determination of the worst-case latency of a system quite easy, since the wakeup latency of such a process immediately represents the latency of the system. If we measure long enough, or preferably continuously, we will be able to reliably describe a system's real-time capabilities.
Latency of several processes that share the highest priority of a system
If several processes share the highest priority of a system, it is possible that they are woken up shortly after each other in such a way that one process is already running while the other still awaits to be switched to. In this case, the wakeup latency of the second process includes the worst-case runtime duration of the first process. In consequence, such latency values reflect a system's priority design rather than its real-time capabilities.
From theory to practice
The latency histograms that are part of the PREEMPT_RT patched kernel now contain the ability to record both latency types. If the kernel configuration item CONFIG_WAKEUP_LATENCY_HIST is enabled, histograms (one per CPU) are created in the directories
/sys/kernel/debug/tracing/latency_hist/wakeup/CPUx
and
/sys/kernel/debug/tracing/latency_hist/wakeup/sharedprio/CPUx
containing single-priority and shared-priority latencies, respectively. The isolated single-priority latencies make it possible, for the first time, to continuously monitor the apparent wakeup latency of a system, e.g. using the Munin monitoring tool. The Munin plugin stores the maximum latency values of consecutive five-minute periods; thus, the derived latency maximum (Max:) at the footer of the graphics (the maximum of individual maximum values) correctly represents the worst-case latency of the entire plotted period (day, week, month etc.). The displayed minimum (Min:) and average (Avg:) latency values, however, are incorrect (since they are calculated from five-minute maximum values rather than from raw data), but we do not care about the minimum or average latency anyway. Here are some examples:
")
Example 1: Wakeup latency by day, 4-way (Core 2 Quad) processor under various conditions: idle state (5 am to 2 pm) / cyclictest with heavy RT load (2 pm to 7 pm) / idle state (7 pm to 11 pm) / mostly non-RT load (11 pm to 3 am) / idle state (3 am to 11 am). The latency values are in the expected order of magnitude and have been confirmed by cyclictest.
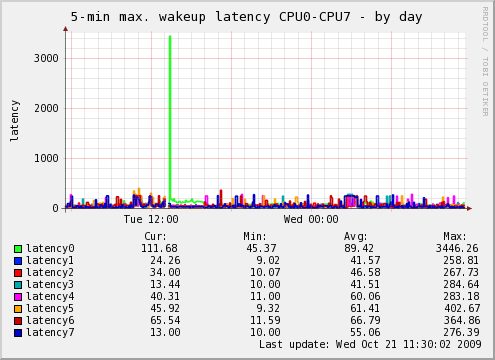
Example 2: Wakeup latency by day, 8-way (i7) processor, artificially created latency (at 1:20 pm) by disabling preemption for about 3.5 ms, relatively high worst-case latency values confirmed by cyclictest, presence of system management interrupts confirmed by hwlat_detector.
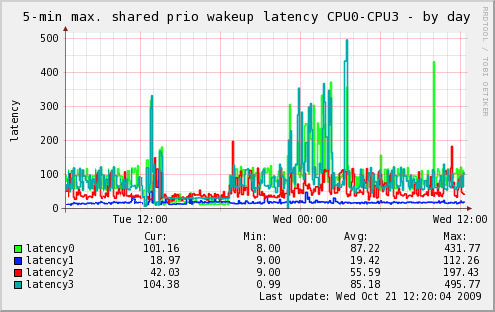
Example 3: Shared-priority wakeup latency by day, 4-way (Core 2 Quad) processor. These latencies do not necessarily reflect the worst-case latency of the system, since several processes (e.g. sirq-timer, sirq-sched etc.) shared the maximum priority (e.g. -50), and these processes may not be critical in a given RT environment. Note that the latencies disappeared during cyclictest run (2 pm to 7 pm) when the exclusively prioritized cyclictest threads were overrunning the less prioritized shared-priority tasks.
- Related News:
 Quality assessment of Linux real-time now online! - 2010-08-13 12:00

