

 SPS smart production solutions 2022
HOWTO: Create a frequency plot from hardware latency detector tracer hwlat
Quick description with inlined code
1. Run the hwlat tracer for 30 minutes and store the result in a temporary file
cd /sys/kernel/debug/tracing
echo hwlat >current_tracer
sleep 1800
cat trace >/tmp/hwlatresult
echo nop >current_tracer
echo -n >trace
cd /tmp
2a. Extract the SMI latency values and store inner and outer data in separate files
grep -v -e "^#" -e nmi- hwlatresult | grep -o " [0-9]*/[0-9]* " | cut -d/ -f1 | tr -d " " | grep -v "^0$" | sort -n >inner
grep -v -e "^#" -e nmi- hwlatresult | grep -o " [0-9]*/[0-9]* " | cut -d/ -f2 | tr -d " " | grep -v "^0$" | sort -n >outer
2b. Alternatively, extract the NMI latency values and store inner and outer data in separate files
grep -v -e "^#" hwlatresult | grep nmi- | grep -o " [0-9]*/[0-9]* " | cut -d/ -f1 | tr -d " " | grep -v "^0$" | sort -n >inner
grep -v -e "^#" hwlatresult | grep nmi- | grep -o " [0-9]*/[0-9]* " | cut -d/ -f2 | tr -d " " | grep -v "^0$" | sort -n >outer
3. Calculate maximum value
maxinner=`tail -1 inner | tee maxinner`
maxouter=`tail -1 outer | tee maxouter`if test $maxinner -gt $maxouter
then
  max=$maxinner
else
  max=$maxouter
fi
4. Create two-column frequency data
echo -n >innerdata
echo -n >outerdata
for i in `seq 0 $max`
do
  echo $i `grep "^$i$" inner | wc -l` >>innerdata
  echo $i `grep "^$i$" outer | wc -l` >>outerdata
done
5. Create plot command header
echo -n -e "set title \"Latency\"\n\
set terminal png\n\
set xlabel \"Latency (us) - Maximum inner $maxinner/outer $maxouter us\"\n\
set logscale y\n\
set xrange [0:400]\n\
set yrange [0.8:*]\n\
set ylabel \"Number of SMI latency samples\"\n\
set output \"plot.png\"\n\
plot " >plotcmd
6. Append plot command data references
for i in inner outer
do
  if test $i != inner
  then
    echo -n ", " >>plotcmd
  fi
  title=$i
  echo -n "\"${i}data\" using 1:2 title \"$title\" with histeps" >>plotcmd
done
7. Execute plot command
gnuplot -persist <plotcmd
8. Enjoy
firefox plot.png
Download the script
Bash script (must be run as root) | 1.5 K |
Example plot
And this is how the resulting image may look like.
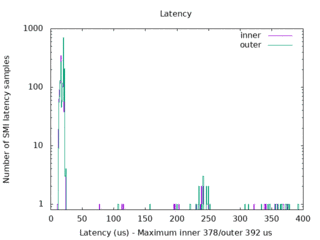
- Example latency plot (click to enlarge)


