Dates and Events:
|
OSADL Articles:
2023-11-12 12:00
Open Source License Obligations Checklists even better nowImport the checklists to other tools, create context diffs and merged lists
2022-07-11 12:00
Call for participation in phase #4 of Open Source OPC UA open62541 support projectLetter of Intent fulfills wish list from recent survey
2022-01-13 12:00
Phase #3 of OSADL project on OPC UA PubSub over TSN successfully completedAnother important milestone on the way to interoperable Open Source real-time Ethernet has been reached
2021-02-09 12:00
Open Source OPC UA PubSub over TSN project phase #3 launchedLetter of Intent with call for participation is now available |
You can tune a piano - and you can tuna Linux system, too!
New versatile tools are helping us to manage real-time challenges under Linux (but you still can't tuna fish).
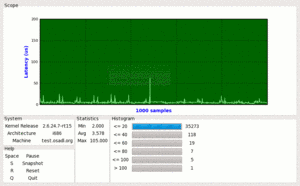
Do you wish you had a built-in oscilloscope that continuously displays the latency of your system? Here is one - thanks to Arnaldo Carvalho de Melo who not only wrote the oscilloscope but also the graphical process inspection and modification tool tuna that is part of the same tool package. In addition, these tools are not only very versatile tools that help us to manage real-time challenges - they also are excellent examples of the power and the beauty of the Python script language and its libraries.
However, before we can install and run these tools, we must learn a little bit about cyclictest and its command line arguments, since this is where oscilloscope gets its data from.
Cyclictest
Cyclictest was initially written by Thomas Gleixner as an in-house tool to investigate possible regressions while developing the RT Preempt patches. Today, it is the state-of-the-art measurement tool to determine the internal worst-case latency of a Linux real-time system. No new version of the RT Preempt patches is ever released without having run cyclictest successfully on the new kernel. The git tree that contains the cyclictest tool can be cloned
KERNELGIT=git://git.kernel.org/pub/scm/linux/kernel/git
git clone $KERNELGIT/clrkwllms/rt-tests.git
but the software is also available as tarball. On an RPM package system such as Redhat Enterprise Linux or Fedora, simply type
cd rt-tests
make release
mv rt-tests-*.tar.gz releases
make rpm
rpm -Uvh RPMS/i386/rt-tests-0*.i386.rpm
to build and install it. Mandatory arguments of cyclictest are -n (use clock_nanosleep) and -p99 (RT priority) on a uniprocessor and additional -a -t (one thread per CPU each on its own processor) on a multi-processor system. If in doubt, the -m option may be used to prevent the cyclictest memory from being paged to the swap area. In order to run as many consecutive threads as possible and to achieve the highest probability to meet a latency, the thread interval (-i option) should be about twice as long as the expected worst-case latency, and the thread delay (-d option) should be set to the interval divided by the number of CPUs. Here is an example of a cyclictest run on a Core 2 Duo, 64-bit, 2.4-GHz board:
# cyclictest -a -t -n -p99 -i100 -d50
560.44 586.11 606.12 211/1160 3727
T: 0 (18617) P:99 I:100 C:1011846111 Min:  2 Act:  4 Avg:  5 Max: 39
T: 1 (18618) P:98 I:150 C: 708641019 Min:  2 Act:  5 Avg: 11 Max: 57
The test was running on a linux-2.6.24.7-rt15 kernel in parallel with repeated loops of "hackbench 25","ls -Ral /", and flood ping from outside. After having executed more than one billion cyclictest loops, the internal worst-case latency is still only 39 µs!
Tuna
The tuna tool is downloaded from the git repository and installed using the command sequence (updated on February 2, 2009):
KERNELGIT=git://git.kernel.org/pub/scm/linux/kernel/git
git clone $KERNELGIT/acme/python-linux-procfs.git
cd python-linux-procfs
make rpm
rpm -Uvh rpm/RPMS/noarch/python-linux-procfs-*.noarch.rpm
cd -
git clone $KERNELGIT/acme/tuna.git
cd tuna
make rpm
rpm -Uvh rpm/RPMS/noarch/tuna-*.noarch.rpm \
         rpm/RPMS/noarch/oscilloscope-*.noarch.rpm
Start tuna simply by running it in an X Window environment. Now, what can you get from tuna?  First, the output is very similar to the output of the well-known command line tool top. In addition, tuna has a much easier interface to arrange the display, to show threads etc. -
  but most importantly, it lets you modify many process settings such as the scheduling priority and policy (click on the right mouse button while the cursor is above one of the process lines). It also has a special menu (click on the right mouse button while the cursor is above the CPU Usage frame) to include or isolate the available processors.
Oscilloscope
Finally, here comes the oscilloscope tool. It uses cyclictest's special -v option that causes the data to be continuously written to standard output path so they can be evaluated by another program connected via pipe. In this case, we can only run a single thread and, unfortunately, we cannot use the -i option explained above, since the oscilloscope has only a limited capacity (will be covered later). To get a first impression, run oscilloscope with the following command:
cyclictest -t1 -n -p99 -v | oscilloscope >/dev/null
Cool, isn't it? You may even increase the number of samples on screen using the -s option such as
cyclictest -t1 -n -p99 -v | oscilloscope -s1000 >/dev/null
 Unfortunately, this will not capture every possible latency, since the cyclictest thread only runs once per millisecond. If we run it faster, for example by specifying -i100, our oscilloscope will be unable to follow. We have, therefore, implemented cyclictest's -o option (oscilloscope mode). This option lets cyclictest reduce the output by the given factor and write only the maximum value that occurred during the specified period of time. The command
cyclictest -t1 -n -p99 -i100 -o10 -v | oscilloscope -s1000 >/dev/null
will then probably be able to provide a much better picture of the worst-case latency of a given system - as a disadvantage, however, the statistics given in the oscilloscope display are incorrect: The numbers no longer reflect the original raw samples but are based on preprocessed reduced data. However, since this is in any case a more pessimistic view, there is no danger that we underestimate the worst-case latency of the system.
Thank you, Thomas and Arnaldo, for all this wonderful software!


