

 SPS Smart Production Solutions 2021 - Canceled
HOWTO: Create a latency plot from cyclictest histogram data
Quick description with inlined code
1. Redirect the output of cyclictest to a file, for example
cyclictest -l100000000 -m -Sp90 -i200 -h400 -q >output
(Please note that this will take 5 hours and 33 minutes.)
2. Get maximum latency
max=`grep "Max Latencies" output | tr " " "\n" | sort -n | tail -1 | sed s/^0*//`
3. Grep data lines, remove empty lines and create a common field separator
grep -v -e "^#" -e "^$" output | tr " " "\t" >histogram
4. Set the number of cores, for example
cores=4
(If the script is used on a variety of systems with a different number of cores, this can, of course, be determined from the system.)
5. Create two-column data sets with latency classes and frequency values for each core
for i in `seq 1 $cores`
do
  column=`expr $i + 1`
  cut -f1,$column histogram >histogram$i
done
6. Create plot command header
echo -n -e "set title \"Latency plot\"\n\
set terminal png\n\
set xlabel \"Latency (us), max $max us\"\n\
set logscale y\n\
set xrange [0:400]\n\
set yrange [0.8:*]\n\
set ylabel \"Number of latency samples\"\n\
set output \"plot.png\"\n\
plot " >plotcmd
7. Append plot command data references
for i in `seq 1 $cores`
do
  if test $i != 1
  then
    echo -n ", " >>plotcmd
  fi
  cpuno=`expr $i - 1`
  if test $cpuno -lt 10
  then
    title=" CPU$cpuno"
   else
    title="CPU$cpuno"
  fi
  echo -n "\"histogram$i\" using 1:2 title \"$title\" with histeps" >>plotcmd
done
8. Execute plot command
gnuplot -persist <plotcmd
9. Enjoy
firefox plot.png
Download the script
Bash script (must be run as root) | 1.2 K |
Example plot
And this is how the resulting image may look like.
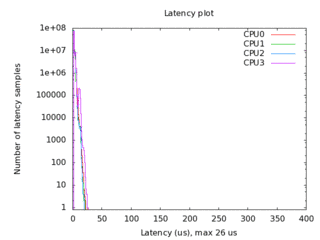
- Example latency plot (click to enlarge)


