[ 290.152] (II) VESA: driver for VESA chipsets: vesa

Note that at least one system runs a non-RT kernel (x scale expanded to 2000 µs).
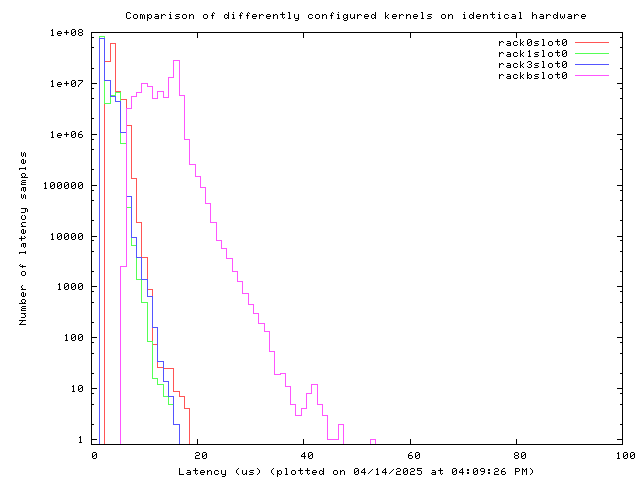
Data to construct the above plot have been generated using the RT test utility cyclictest.
OSADL QA Farm on Real-time of Mainline Linux
About - Hardware - CPUs - Benchmarks - Graphics - Benchmarks - Kernels - Boards/Distros - Latency monitoring - Latency plots - System data - Profiles - Compare - Awards
Effect of kernel optimization on latency distribution
|
Rack #0/#0 #1 #2 #3 #4 #5 #6 #7 #8 - Rack #1/#0 #1 #2 #3 #4 #5 #6 #7 #8 - Rack #2/#0 #1 #2 #3 #4 #5 #6 #7 #8 - Rack #3/#0 #1 #2 #3 #4 #5 #6 #7 #8 - Rack #4/#0 #1 #2 #3 #4 #5 #6 #7 #8 - Rack #5/#0 #1 #2 #3 #4 #5 #6 #7 #8 - Rack #6/#0 #1 #2 #3 #4 #5 #6 #7 #8 - Rack #7/#0 #1 #2 #3 #4 #5 #6 #7 #8 - Rack #8/#0 #1 #2 #3 #4 #5 #6 #7 #8 - Rack #9/#0 #1 #2 #3 #4 #5 #6 #7 #8 - Rack #a/#0 #1 #2 #3 #4 #5 #6 #7 #8 - Rack #b/#0 #1 #2 #3 #4 #5 #6 #7 #8 - Rack #c/#0 #1 #2 #3 #4 #5 #6 #7 #8 - Rack #d/#0 #1 #2 #3 #4 #5 #6 #7 #8 - Rack #e/#0 #1 #2 #3 #4 #5 #6 #7 #8 - Rack #f/#0 #1 #2 #3 #4 #5 #6 #7 #8 Special All - All RT - Optimization - Ethernet - Thumbnails |
Selected systems under test (Latency monitoring)

Note that at least one system runs a non-RT kernel (x scale expanded to 2000 µs).
Data to construct the above plot have been generated using the RT test utility cyclictest.


