Dates and Events:
|
OSADL Articles:
2023-11-12 12:00
Open Source License Obligations Checklists even better nowImport the checklists to other tools, create context diffs and merged lists
2022-07-11 12:00
Call for participation in phase #4 of Open Source OPC UA open62541 support projectLetter of Intent fulfills wish list from recent survey
2022-01-13 12:00
Phase #3 of OSADL project on OPC UA PubSub over TSN successfully completedAnother important milestone on the way to interoperable Open Source real-time Ethernet has been reached
2021-02-09 12:00
Open Source OPC UA PubSub over TSN project phase #3 launchedLetter of Intent with call for participation is now available |
The Linux task viewer is here
Kernel developers are walking in user space and beyond
Recently, Steven Rostedt posted a short message on a newly released interface to the Linux kernel tracing system (Ftrace) of which he is the maintainer. Steven presented an in-depth paper on Ftrace on the 11th Real Time Linux Workshop in Dresden, Germany, in September 2009.
Up to now, however, nobody ever answered the posting or commented on it. So it looks like it got lost in the myriads of postings to the LKML.
Among others, the announcement says:
What is trace-cmd?
------------------
trace-cmd is a user interface to Ftrace. Instead of needing to use
the debugfs directly, trace-cmd will handle of setting of options
and tracers and will record into a data file.
Hmm, command line tool. Kernel developers don't care, but users who may have read this announcement may not be tempted to try out the new tool.
Anyway, we do it
ROSTEDT=git://git.kernel.org/pub/scm/linux/kernel/git/rostedt
git clone $ROSTEDT/trace-cmd.git trace-cmd-stable-v1
cd trace-cmd-stable-v1
and then, we type:
make
So far, so good. A very powerful and well documented command-line tool, indeed, was created. But wait, what does the line at the bottom say?
Note: to build the gui, type "make gui"
GUI? Graphical User Interface? Oops, the announcement didn't say anything on a GUI. What's that?
make gui
make install
make install_gui
Let's try it out and record everything that is happening on our system:
trace-cmd record -e all
disable all
enable all
Hit Ctrl^C to stop recording
Wait a while ..., then stop the recording with Ctrl^C. The program displays:
offset=14c000
offset=7c0c000
etc.
followed by
Kernel buffer statistics:
  Note: "entries" are the entries left in the kernel ring buffer and
        are not recorded in the trace data. They should all be zero.
CPU: 0
entries: 0
overrun: 3728397
commit overrun: 0
etc.
And then start the GUI analyzer:
kernelshark
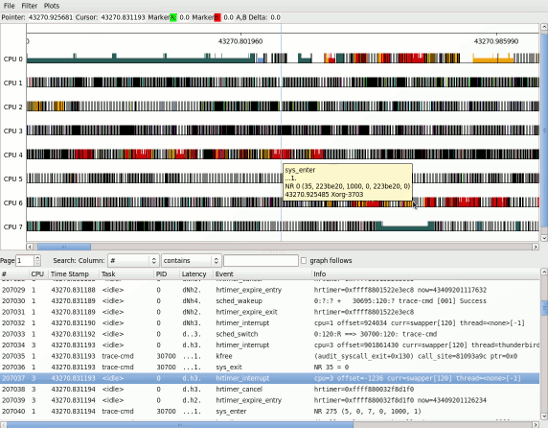
When live, one can easily navigate through the plots and lists. The time scale and the displayed time period is selected with the mouse. Search and sort functions allow to select specific events. Info boxes will display related data when moving the mouse on top of the event plots.
Click on the image to download and display the screen shot at full size. Isn't that amazing? It is well conceivable that Debian, Fedora, Red Hat et al. will provide a related software package soon; the above compilation and installation procedure can then be avoided.
Steven also wrote a fairly complete documentation of the kernelshark trace analyzer. It is in HTML format and available here. Thank you, Steven, for all the good work!


