OSADL QA Farm on Real-time of Mainline Linux
About - Hardware - CPUs - Benchmarks - Graphics - Benchmarks - Kernels - Boards/Distros - Latency monitoring - Latency plots - System data - Profiles - Compare - Awards
Select latency plot of system or system group to display
|
Rack #0/#0 #1 #2 #3 #4 #5 #6 #7 #8 - Rack #1/#0 #1 #2 #3 #4 #5 #6 #7 #8 - Rack #2/#0 #1 #2 #3 #4 #5 #6 #7 #8 - Rack #3/#0 #1 #2 #3 #4 #5 #6 #7 #8 - Rack #4/#0 #1 #2 #3 #4 #5 #6 #7 #8 - Rack #5/#0 #1 #2 #3 #4 #5 #6 #7 #8 - Rack #6/#0 #1 #2 #3 #4 #5 #6 #7 #8 - Rack #7/#0 #1 #2 #3 #4 #5 #6 #7 #8 - Rack #8/#0 #1 #2 #3 #4 #5 #6 #7 #8 - Rack #9/#0 #1 #2 #3 #4 #5 #6 #7 #8 - Rack #a/#0 #1 #2 #3 #4 #5 #6 #7 #8 - Rack #b/#0 #1 #2 #3 #4 #5 #6 #7 #8 - Rack #c/#0 #1 #2 #3 #4 #5 #6 #7 #8 - Rack #d/#0 #1 #2 #3 #4 #5 #6 #7 #8 - Rack #e/#0 #1 #2 #3 #4 #5 #6 #7 #8 - Rack #f/#0 #1 #2 #3 #4 #5 #6 #7 #8 Special All - All RT - Optimization - Ethernet - Thumbnails |
What are latency plots?
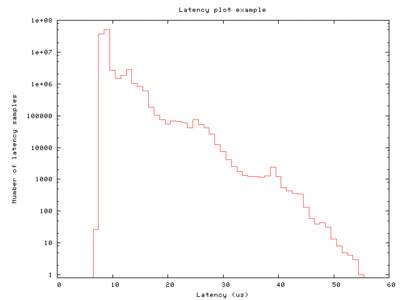
Latency plots are used to graphically present the result of a latency determination of a real-time computer system. They are a special form of a frequency histogram with latency categories at the x scale and counts of samples that fall into a particular latency range at the y scale. A statistician would call it a distribution curve. It is often recommended to use linear scale divisions at the x scale and a logarithmic y scale. This makes it possible to graphically represent even very low frequencies and, particularly, the highest latency ever observed, since high latencies usually occur only rarely. The highest latency ever observed, the so-called "worst-case latency", represents the most important result of a latency plot.
The picture at the right shows an example of a latency plot gained on a single-core computer system. In this plot, the "worst-case latency" amounts to 55 µs. Click on the image to display it at the original resolution; this way, the stair-step-like pattern of the curve becomes clearly visible. The length of each step represents the size of every latency category and, thus, its resolution. The latency resolution of all OSADL latency plots is 1 microsecond.
How do we generate the latency plots?
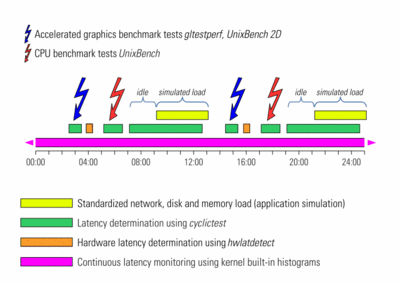
The systems of the OSADL QA Farm undergo repeated periods of idle and load conditions as depicted in the figure at the left (click on the image or here to display it a full size) and as can be seen in the time course of continuous real-time monitoring. The two main measurement periods of the cyclictest program to determine the system's worst case latecny start at 7:10 a.m. and 7:10 p.m. and have a duration of five hours and 33 minutes. The cyclictest program itself creates a relatively high interrupt load but no other relevant load that may interfere with the system and particularly the scheduler. After the first two hours of this system state that is close to an idle system, a defined mid-range load is generated in an attempt to simulate an average machine control program. It generates about 1 Mbit/s network load, 1 MByte/s I/O and filesystem load and 1 MByte/s memory allocation load. The resulting overall system load during the remaining three hours and 33 minutes amounts to about 30 to 50%.
A second cyclictest run starts at 2:30 a.m. and 2:30 p.m., respectively, during which the gltestperf benchmark of the accelerated graphics processor (GPU) is executed. This benchmark was written by David Bucciarelli and is part of the mesa-demos package. In addition, a 2D graphics benchmark, the 2D part of the unixbench program, is run. Again, the purpose is to evaluate the influence of the graphics processor on the real-time performance of the entire system, if any, and to ![]() provide the benchmark results to assist system integrators when selecting CPU and GPU for a given project.
provide the benchmark results to assist system integrators when selecting CPU and GPU for a given project.
A third cyclictest run starts at 5:05 a.m. and 5:05: p.m., respectively, during which the ![]() UnixBench CPU benchmark test is running which takes 30 to 60 minutes to complete depending on the numbers of cores of the CPU. The purpose of this CPU benchmark is twofold: First, the relatively high peak load that is generated during this benchmark is used to challenge the real-time capabilities of the systems. Second, the results are stored and
UnixBench CPU benchmark test is running which takes 30 to 60 minutes to complete depending on the numbers of cores of the CPU. The purpose of this CPU benchmark is twofold: First, the relatively high peak load that is generated during this benchmark is used to challenge the real-time capabilities of the systems. Second, the results are stored and ![]() made available to the public to facilitate the selection of an appropriate CPU for a particular project. By clicking on the header of a particular table column, the systems can be ordered according to the variable of this column (e.g.
made available to the public to facilitate the selection of an appropriate CPU for a particular project. By clicking on the header of a particular table column, the systems can be ordered according to the variable of this column (e.g. ![]() ordered by Dhrystones).
ordered by Dhrystones).
At every end of a cyclictest run, a latency plot is created, uploaded to the Internet and displayed here. Click on an item of the menu bar at the top of this page and select a system's rack and slot number to inspect its most recent latency distribution (e.g. the ![]() 4x1-core 64-bit x86 system in rack #1/slot #0). The latency plots are updated twice daily; the creation date is given at the bottom of every plot. Logged-in users with additional access rights can also display all data that have been stored since the beginning of the recording in May 2011. This allows to determine the worst-case latency with a much higher certainty than based on a single test run only. Access to the latency plots during accelerated graphics load as well as to a summary graph on the effect of accelerated graphics on the worst-case latency also requires additional user rights.
4x1-core 64-bit x86 system in rack #1/slot #0). The latency plots are updated twice daily; the creation date is given at the bottom of every plot. Logged-in users with additional access rights can also display all data that have been stored since the beginning of the recording in May 2011. This allows to determine the worst-case latency with a much higher certainty than based on a single test run only. Access to the latency plots during accelerated graphics load as well as to a summary graph on the effect of accelerated graphics on the worst-case latency also requires additional user rights.
Below every latency plot, the original cyclictest command, the number of individual samples and the duration of the measurement are given.


