

Dates and Events: |
OSADL Articles:
2023-11-12 12:00
Open Source License Obligations Checklists even better nowImport the checklists to other tools, create context diffs and merged lists
2022-07-11 12:00
Call for participation in phase #4 of Open Source OPC UA open62541 support projectLetter of Intent fulfills wish list from recent survey
2022-01-13 12:00
Phase #3 of OSADL project on OPC UA PubSub over TSN successfully completedAnother important milestone on the way to interoperable Open Source real-time Ethernet has been reached
2021-02-09 12:00
Open Source OPC UA PubSub over TSN project phase #3 launchedLetter of Intent with call for participation is now available |
OSADL QA Farm on Real-time of Mainline Linux
About - Hardware - CPUs - Benchmarks - Graphics - Benchmarks - Kernels - Boards/Distros - Latency monitoring - Latency plots - System data - Profiles - Compare - Awards
Wakeup latency of all systems - Real-time optimization - Peer-to-peer UDP duplex link - OPC UA PubSub over TSN - Powerlink - Ethercat - Network load - kvm - Sleep states
Real-time Ethernet (TSN) synchronization analysis (peer-to-peer)
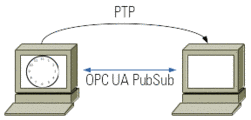
- Peer-to-peer topology with a PTP grandmaster and a PTP slave directly connected to each other

Overview - Peer-to-peer - Star topology - Demonstrator (TSN) - Heterogeneous peer-to-peer - Demonstrator (OPC UA PubSub over TSN)
One of the Linux real-time test systems (rack #c, slot #8 at primary position) serves as PTP grandmaster while receiving global time information via NTP in the same way as all other systems. This PTP server is connected via a peer-to-peer link to another real-time test system (rack #0, slot #8 at shadow position) that is configured as PTP slave. As can be derived from the below depicted jitter plots over time, SO_TXTIME flagged packets such as implemented in an OPC UA PubSub scenario can be sent across the peers with a predictable arrival time at the destination peer. The two computer systems, the PTP grandmaster and the PTP slave, are equipped with an Intel I210-T1 network adapter integrating an Intel I210 network controller.
PTP grandmaster: Jitter analysis from system time to network adapter by week
Last update 16 minutes ago
-

- Please note that the recorded values of this and of all below plots represent the maximum of subsequent 5-min intervals. Thus, from the given numerical values below the plot the only meaningful value is the one in the column labeled "Max:".
PTP client #1: Jitter analysis from network to network adapter and from network adapter to system by week
Last update 15 minutes ago
-

- Jitter analysis from network to network adapter
-

- Jitter analysis from network adapter to system time

